Guidelines used when selecting good research topic

Selecting a good research question is hard for many. Yet most research methods books dont provide practical insight into this subject and they focus more or theory. This places many students into confusion

A research topic is what you want to study in your research thesis or private research. It provides the research question that you need to formulate in terms of testable hypothesis. Before we explain research topic attributes, let us highlight sources of research and may include but not limited to

Magazines and newspapers

Future recommendation of past research papers

Everyday events faced by society whether social, scientific or history

Well a good research topic has the following attributes

  1. Research topic should be specific.

What this means is that research topic should not be broad or general. Broad topics lead to failure due to increased time, cost, and complexity. For example a broad research question is “Effect of social media on student scores”. This topic is broad as we dont know which social media (Facebook, Twitter, Telegram) the research intends to study. Student scores is also broad (high school, college, university). A good and specific research topic would be “Study of the effect of Facebook on high school students scores”

2. Research topic should be possible to study

What this means is that a research topic should make sense with current settings. For example, if your research topic is “Assessment of dependency between IQ and sleeping for people who dont use smartphone”. Clearly this topic is hard to study as there is not people who dont use smartphone in the current setting (in the current world or environment)

3. Research topic should have rich availability of literature review

What this means is that a research topic should be able to get literature review of past research papers that relate to your research topic. In that case you will avoid plagiarism by obtaining gaps not answered by that past research papers. You could be get further information from the literature review study such as research methodology used the past paper, findings obtained and conclusions reached

4. Research topic should have research signficance

It should answer or solve or add on existing problems that is significance to society or your organization

5. Research question generated from the research topic should have external validity

What this means the findings of the research should be applicable at the population level. It should have general application and easily expandable by future research interests

An example of research topic along with research question and how to test the research hypothesis is given in the table below

Research topicResearch questionStatistical analysis
“Assessment on the effect of        Facebook on exam grades of form       four Students”Does the use of Facebook has an  Effect on exam score of form four Students?      Independent samples t-test
“Study on correlation between University reputation and number of enrolled students”Is there positive correlation Between university reputation and Number of enrolled students?Spearman rank correlation
“Study on association between  income and education level”Do earning different income scale independent on education level?Chi-square

A new book simplifying both in theory and SPSS statistics for research can be obtained in the Amazon kindle link below

Thanks

Please post your questions in the comment section

Factorial ANOVA

In one-factor ANOVA, we normally treat one independent variable on the dependent measured variable. In factorial ANOVA, we increase the number of factors from one to see not only the impact of each individual factor, but also more importantly draw conclusion about the interaction effect of all the factors

Factorial design or experiment addresses on testing the effect of multiple factors (independent variables) on the dependent variable

 Factor B
Factor A Level 1Level 2… Level j 
Level 1Cell 11Cell 12Cell 1j 
Level 2Cell 21Cell 22Cell 2j 
… Level kCell k1Cell k2Cell kj 
     

From the above table, each factor is divided into its possible combinations (factorial)

Let us take an example of 2 x 2 factorial ANOVA test where each independent variable has two possible levels. Suppose we want to study student test scores in certain university. The university offers two class sessions. One in the morning and another in the evening. The university also offers two teaching modes for each session. Online teaching and in-class teaching. In this case we have two factors or independent variable. Class session is factor A while teaching mode is factor B

In factorial ANOVA we want to test the interaction effect of both factor A and factor B as well as individual effects of either factor A or factor B

To conduct the experiment two students are randomly selected for each cell in the table above. For example we test two students in cell 11, another two students in cell 12 an so on. In ANOVA terminology we say we replicated each cell of the table above with two subjects

Our example is summarized in the table below along with test scores of the replications

 Teaching mode
Class session In-classOnline
Morning67 7158 65
Evening71 7366 70

From this table, we have total of 8 experimental units while replication per treatment is 2

Now the interaction question is

“Do some students in one teaching mode score better in one class session while other students in different teaching mode score better in another class session?”

To test the hypothesis, we will use F – distribution by calculating the F – statistic

To understand how to calculate the F-statistic for factor A, factor B and the interaction factor, we first need to have the following formulas

The term

Is called MSE (mean square due to error)

The above formula looks totally confusing and lengthy. To simplify it let calculate F-statistic for factor A levels

We break down the formula as below

Factor A mean can be calculated as

MorningMean11 = (67+71)/2 = 69Mean12 = (58+65)/2 = 61.5Total mean = (69+61.5)/2 = 65.25
EveningMean21 = (71+73)/2 = 72Mean22 = (66+70)/2 = 68  Total mean = (72+68)/2 = 70

Factor B mean can be calculated as

In-classOnline
Mean11 = (67+71)/2 = 69Mean12 = (58+65)/2 = 61.5
Mean21 = (71+73)/2 = 72Mean22 = (66+70)/2 = 68
Total mean = (69+72)/2 = 70.5Total mean = (61.5+68)/2 = 64.75

Overall mean = (65.25 + 70 + 70.5 + 64.75)/4 = 67.625

Now we continue working on the remaining parts of the above F formula

Now we compute variance of factor A. As an example level 1 (morning) cells (11 and 12)

x
6765.251.753.06251.02
7165.255.7533.062511.02
5865.25-7.2552.562517.52
6565.25-0.250.06250.021
    Variance = 29.581

Similarly variance of factor A level 2 (evening) is 8.67

Next we calculate the MSE to finalize the calculation of the F-statistic

Now the F-statistic is

Hence the F-statistic due to factor A only is 4.718.

You see how the computation of factor A only is tedious. You are still required to compute F-statistic for factor B and the interaction of both factor A and B

Hence it is recommended to use computer statistical software to analyze the factorial or two-way ANOVA. In our case we will use SPSS as follows

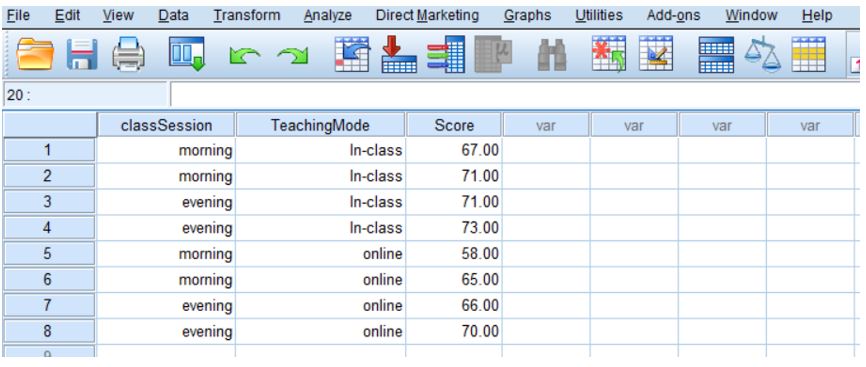
First step is data entry as shown below. We create for the two independent variables and the dependent variables

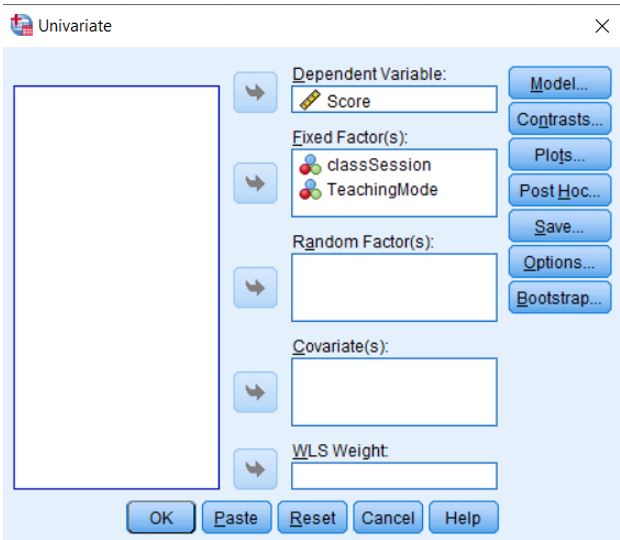
Next go to analyze > General linear models > Univariate to pop up the Univariate dialog box

Once everything is setup as shown above, click ok to generate the following results dialog box

Between-Subjects Factors
 Value LabelN
classSession1.00morning4
2.00evening4
TeachingMode1.00In-class4
2.00online4
Tests of Between-Subjects Effects
Dependent Variable:   Score 
SourceType III Sum of SquaresdfMean SquareFSig.
Corrected Model117.375a339.1253.682.120
Intercept36585.125136585.1253443.306.000
classSession45.125145.1254.247.108
TeachingMode66.125166.1256.224.067
classSession * TeachingMode6.12516.125.576.490
Error42.500410.625  
Total36745.0008   
Corrected Total159.8757   
a. R Squared = .734 (Adjusted R Squared = .535)

The final part is interpretation of the tests between subjects effects table

  • The p-value of the classSession factor is greater than the test significance (0.108 > 0.05). Hence we accept the null hypothesis that the two class session shown no score difference
  • The p-value of the TeachingMode factor is greater than the test significance (0.067 > 0.05). Hence we accept the null hypothesis and conclude that there is no statistical evidence showing the two teaching modes produce different student scores
  • The p-value of the interaction is greater than the test significance (0.490 > 0.05). Hence there is not difference of student scores in once class session and teaching mode than those in another class session and teaching mode

Statistical data analysis with SPSS to answer private and academic research question

Are you a student in his/final year research book who want to write successful dissertation? Are you academician doing academic researcher or worker who want to boost his private research skills? Do you want to learn and master descriptive and inferential statistics at your own pace in very short time?

If your answer to above questions is YES, then you are the right place. The link below takes you to my “statistics guide for students and researchers with SPSS illustration” book on Amazon. Buy the eBook or paperback version and have assurance that you will learn statistics in easiest way possible.

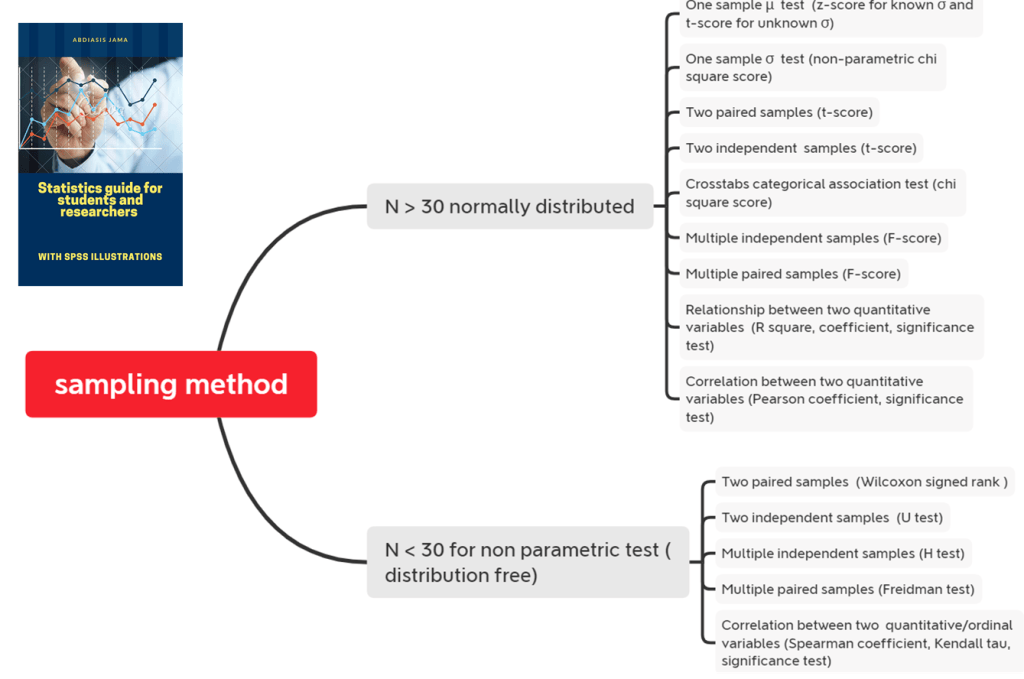
The book contains both hand calculation and in SPSS practice the skills shown in the diagram below

To ask further explanation or book review question answer, subscribe to the page so that you do not miss anyone of new updates

Create your own website, free on WordPress.com.Create your own website.
Start free